Rated 5 star on


Franchise ML: Location Performance Models
Quick answer
Franchise brands should judge each location against what it should achieve, not raw sales rankings. A machine learning model estimates expected sales from trade area, traffic, competition, season and size. The gap between expected and actual results shows who is truly struggling. Share findings with franchisees as support, with reasons they can act on.
Ranking franchise locations by sales tells you who sells the most, not who performs best. A unit in a busy area can lead on revenue while underperforming. An owner in a tough market may be doing remarkably well. Location performance models compare each unit with what it should achieve, which is a fairer and more useful measure.
Key Takeaways
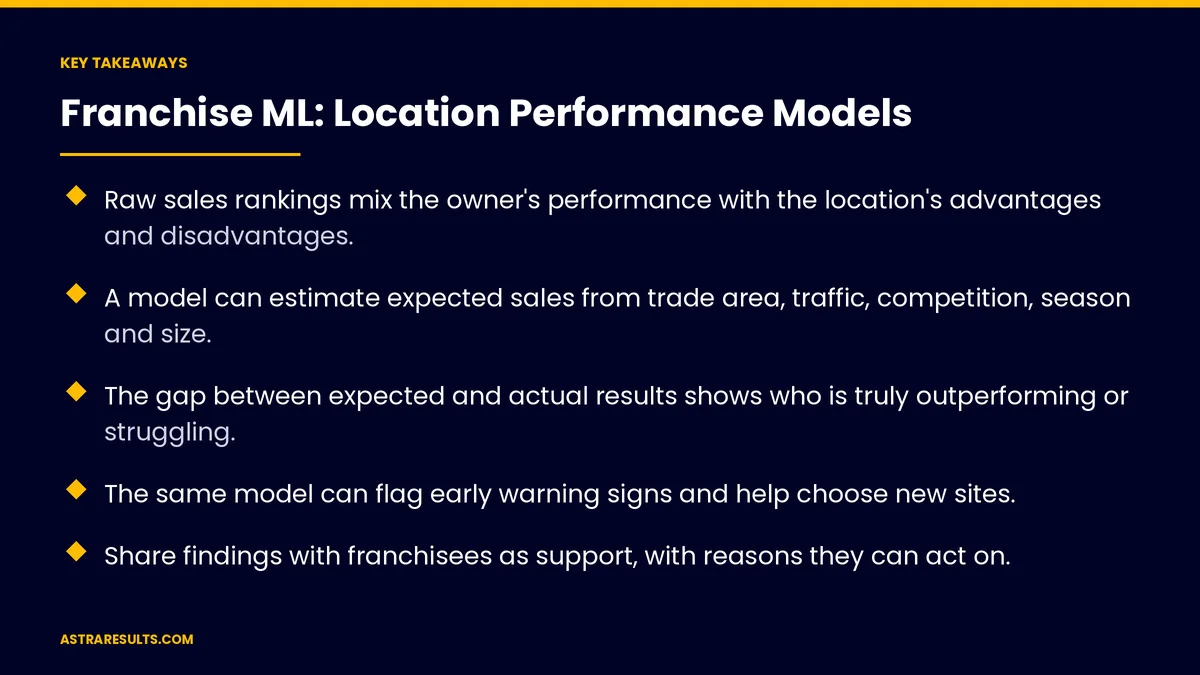
- Raw sales rankings mix the owner's performance with the location's advantages and disadvantages.
- A model can estimate expected sales from trade area, traffic, competition, season and size.
- The gap between expected and actual results shows who is truly outperforming or struggling.
- The same model can flag early warning signs and help choose new sites.
- Share findings with franchisees as support, with reasons they can act on.
- Clean, shared data and clear rules about how it's used come before any model.
Published: October 9, 2026 | Reading Time: ~9 minutes | Category: Machine Learning & Analytics
This guide covers how franchise brands use machine learning to estimate expected performance for each location, find the gap between expected and actual results, spot problems early, choose new sites and share the findings with franchisees in a way that helps. Put plainly: judge each location against its own potential, not against the network average.
In This Playbook
- Why sales rankings mislead
- What a location performance model does
- The data it needs
- Reading the gap
- Early warning signs
- Choosing new sites
- Sharing findings with franchisees
- Keeping the model fair
- How do we measure a location performance model?
- The first three months
Why sales rankings mislead
Locations aren't equal. Population, traffic, income, competition and visibility differ from one trade area to the next.
Age matters. New units ramp up; mature units plateau.
Season and weather vary. A beach-area unit and a business-district unit have different calendars.
Rankings hide the real story. The top seller may be coasting, and the bottom seller may be doing well against tough conditions.
What a location performance model does
Estimates expected results. For each unit, it predicts sales, traffic or ticket size based on the factors outside the owner's control.
Compares with actual results. The gap shows how much the owner and team add or lose.
Explains the drivers. It shows which factors matter most for each unit.
Updates over time. As new data arrives, expectations and gaps refresh.
The basics of how models are built are covered in the ML stack explained.
The data it needs
Sales and traffic. From each location's point-of-sale system, by day and hour.
Location facts. Size, format, opening date, parking, drive-through and visibility.
Trade area. Population, income and households from public data, plus nearby competitors.
Operations. Staffing levels, hours, service times and local marketing spend.
Customer signals. Reviews and ratings by location.
Shelf data for retail brands. How often products are missing from shelves, as captured by retail vision.
One clean dataset. Data from every unit collected and matched the same way, as explained in data pipelines explained. Shared systems across locations help, as in franchise intake.
Reading the gap
Above expected. Learn what these owners do differently and share it across the network.
Below expected. Look for fixable causes: staffing, hours, service speed, local marketing or reviews.
Close to expected. Steady performers, where small improvements add up.
Check the reasons. A model shows patterns, not causes. Field consultants confirm what's really happening before anyone acts, the same people-in-charge rule used in franchise agents.
Early warning signs
Falling behind expected. A unit drifting below its expected range for several weeks.
Early signals. Slower service, dropping ratings, fewer repeat customers or changing staffing.
Act sooner. Support reaches the owner before a bad quarter becomes a bad year.
Explain each flag. Show the reasons behind it, as with the scored lists in AI outbound scoring.
Choosing new sites
Use what existing units teach. The model learns which trade-area factors drive results.
Score candidate sites. Estimate expected performance before signing a lease.
Include uncertainty. Give a range, not a single number, especially for new markets.
Combine with judgment. Real estate, local knowledge and field visits still matter.
Sharing findings with franchisees
Support, not surveillance. Present results as help to grow, not as a ranking to punish.
Show each owner their own view. Expected range, actual results and the factors that matter for their unit.
Pair findings with help. Training, playbooks and tools, such as a shared franchise app.
Be clear about data use. Explain what data is used and how, within the franchise agreement.
Never automate penalties. Any formal action follows the agreement and human review.
Keeping the model fair
Leave out what owners can't control fairly. Don't blame an owner for a factor the model should account for.
Check across groups. Make sure the model works as well for small, rural or new units as for large urban ones.
Review regularly. Markets change, so retrain and recheck the model on a schedule. The principles are in machine learning for operators.
How do we measure a location performance model?
Prediction accuracy. How close expected results come to actual results for stable units.
Gap trends. Whether struggling units close the gap after support.
Early-warning lead time. How far ahead problems were spotted.
Site results. New units against their pre-opening estimates.
Franchisee use. How often owners open and act on their dashboards.
The first three months
Days 1–30: data and rules
Collect sales, location, trade-area, operations and review data for every unit into one clean dataset. Agree with franchisee leaders how the data will be used. Record current rankings and known problem units.
Days 31–60: build and test
Build the first model of expected results, test it against units the team knows well and check that it works across unit types. Show field consultants the gaps and reasons.
Days 61–90: share and act
Share owner dashboards with expected ranges and drivers. Start early-warning flags confirmed by field consultants. Track whether supported units close their gaps.
How Astra builds location models
Astra Results Marketing builds location performance models that compare each unit with its own potential. We bring sales, location, trade-area and operations data together, estimate expected results with clear reasons, flag problems early and score candidate sites with clear ranges of uncertainty.
Findings are shared with franchisees as support, field consultants confirm every flag, and models are reviewed for fairness. Engagements begin with a data and network review through our machine learning and advanced analytics team.
Related reading
Frequently asked questions
Why not just rank locations by sales?
Because sales mix the owner's performance with the location's advantages. A unit in a busy area can lead on revenue while underperforming its potential, and a unit in a tough market can be doing well. Comparing each unit with its expected results is fairer.
What does a location performance model predict?
Expected sales, traffic or ticket size for each unit, based on factors like trade-area population, income, competition, traffic, size, format, season and how long the unit has been open.
Can the model tell us why a unit is struggling?
It shows patterns and the factors linked to the gap, not certain causes. Field consultants confirm what's happening before anyone acts.
Can it help choose new locations?
Yes. It scores candidate sites based on what existing units teach, with a range of expected results rather than a single number. Real estate judgment and field visits still matter.
How should franchisees see the results?
As support: each owner sees their expected range, actual results and the factors that matter for their unit, paired with training and tools. Never as an automatic ranking that leads to penalties.
What data do we need to start?
Sales and traffic by unit, location facts, trade-area data, staffing and hours, local marketing spend and reviews, collected the same way for every unit.
Ready to judge every location against its own potential? Astra Results Marketing builds location performance models that estimate what each unit should achieve, show the gap with clear reasons, flag problems early and help choose better sites, shared with franchisees as support. ▸ CALL (786) 321-2866 · ▸ REQUEST YOUR CONSULTATION