Rated 5 star on


Website KPIs That Matter to Revenue
Quick answer
The website KPIs that matter to revenue are leads or sales, conversion rate, lead-to-customer rate and revenue per visitor. Traffic alone does not show whether a site makes money. Break conversion down by page, source and device. Connect website leads to your CRM to see which visits became customers. Keep the monthly dashboard small.
Most website reports open with page views, visitors and time on site. Those numbers can rise while sales fall. An owner looking at a busy traffic chart can miss that the contact form broke three weeks ago, or that mobile visitors almost never buy. The numbers worth watching are the ones that move when revenue moves.
Key Takeaways
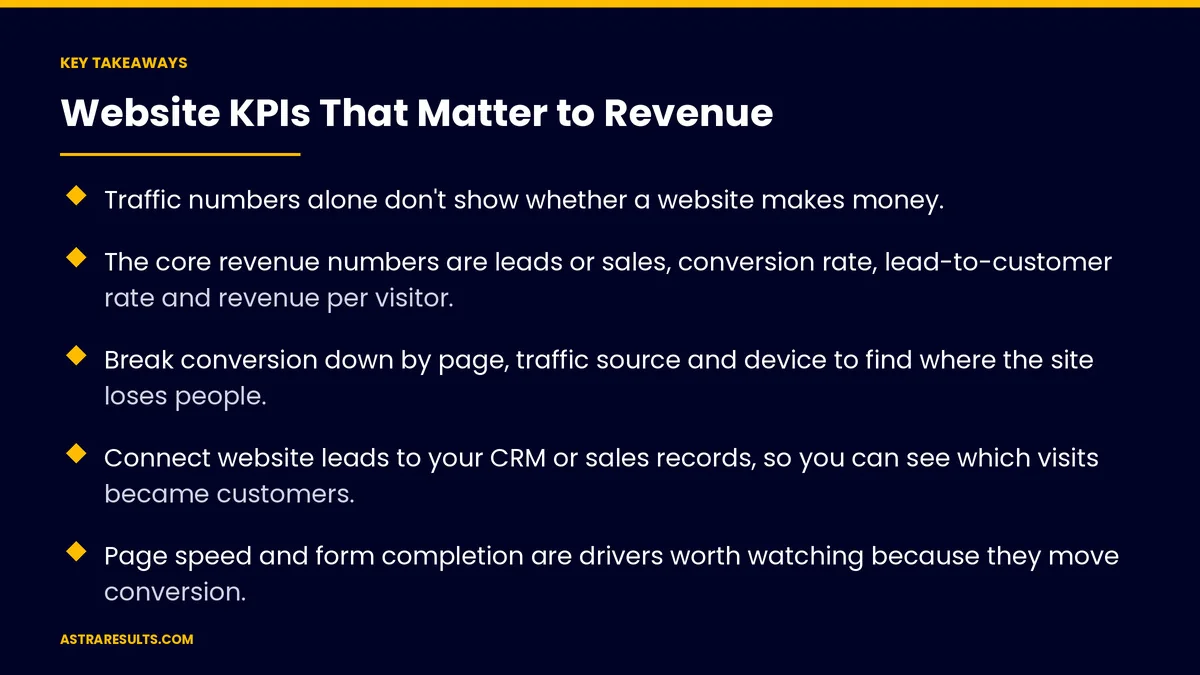
- Traffic numbers alone don't show whether a website makes money.
- The core revenue numbers are leads or sales, conversion rate, lead-to-customer rate and revenue per visitor.
- Break conversion down by page, traffic source and device to find where the site loses people.
- Connect website leads to your CRM or sales records, so you can see which visits became customers.
- Page speed and form completion are drivers worth watching because they move conversion.
- Keep the monthly dashboard to a handful of numbers, each with an owner.
Published: October 23, 2026 | Reading Time: ~9 minutes | Category: UI/UX Web Design
This guide sorts website metrics into the ones that tie to revenue and the ones that only look good, explains how to set up tracking that connects visits to customers, and shows how to use the numbers to improve the site. Put plainly: track what turns visitors into customers, and treat everything else as a clue, not a result.
In This Playbook
- Vanity numbers and real numbers
- The core revenue KPIs
- Break it down to find the leaks
- The drivers worth watching
- Setting up tracking that connects to revenue
- Using the numbers to improve the site
- A simple monthly dashboard
- The first three months
Vanity numbers and real numbers
Vanity numbers. Page views, total visitors, time on site and social shares. They describe activity, not results.
Real numbers. Calls, forms, bookings, orders and the revenue they produce.
Clues in between. Bounce rate, scroll depth and pages per visit can point to problems, but they aren't goals.
The test. If a number went up and revenue didn't, it wasn't a revenue KPI.
The core revenue KPIs
Leads or sales. Calls, form submissions, bookings or orders from the website each month.
Conversion rate. The share of visitors who take the main action. The core of websites that sell.
Lead-to-customer rate. The share of website leads that become paying customers.
Revenue per visitor. Website-driven revenue divided by visitors. It combines traffic quality and conversion in one number.
Cost per lead. For paid traffic, ad spend divided by leads.
Average order value. For stores, the average amount per order.
Break it down to find the leaks
By page. Which service and landing pages convert, and which don't.
By traffic source. Search, ads, social, email and referrals often convert very differently.
By device. Many sites convert far worse on phones. If so, the mobile experience is the first fix.
By language. For bilingual sites, compare English and Spanish pages.
By new and returning visitors. Returning visitors often convert better, which shows how much follow-up matters.
The drivers worth watching
Page speed. Slow pages lose visitors before they see the offer, especially on mobile.
Form completion. The share of people who start a form and finish it. Long forms lose leads.
Checkout completion. For stores, the share who start checkout and buy.
Call button use. Taps on phone numbers from mobile visitors.
Broken paths. Error pages, failed forms and dead links, checked regularly as part of website care plans.
Setting up tracking that connects to revenue
Define your key actions. Calls, forms, bookings and purchases, set up as key events in Google Analytics, the name it now uses for conversions.
Track phone calls. Call tracking links calls to the page and source that produced them.
Tag campaign links. So every ad, email and post can be identified.
Connect to your CRM. Pass lead details to your CRM, so you can see which visits became customers and what they spent. The data side is covered in data pipelines explained.
Credit channels fairly. Customers often visit several times before buying, as covered in attribution across every channel.
Respect privacy. Get consent where required, and avoid collecting personal details you don't need.
Using the numbers to improve the site
Follow the funnel. Find the step where most people drop off: landing, the form, the checkout.
Fix the biggest leak first. One broken step often matters more than ten small design tweaks.
Test changes. Try a new headline, a shorter form or a clearer button on part of your traffic and compare.
Send ads to the right page. Matching pages convert better, as covered in landing page vs homepage.
Answer leads fast. A lead only becomes a customer if someone responds quickly, as covered in speed to lead.
A simple monthly dashboard
Leads or sales. Total, and by source.
Conversion rate. Overall and on mobile.
Lead-to-customer rate. From CRM records.
Revenue per visitor. Month over month.
Page speed on key pages. Mobile load times.
One owner per number. Someone responsible for explaining changes and acting on them.
The first three months
Days 1–30: set up the numbers
Define key actions and set them up as key events. Add call tracking and campaign tags. Connect website leads to your CRM. Record a baseline for leads, conversion rate, lead-to-customer rate and revenue per visitor.
Days 31–60: find the leaks
Break conversion down by page, source, device and language. Check form completion, checkout completion and page speed. List the biggest drop-off points.
Days 61–90: fix and track
Fix the largest leak first, test the change and compare with the baseline. Set up the monthly dashboard with one owner per number, and plan the next improvement.
How does Astra measure website performance?
Astra Results Marketing sets up website tracking that connects visits to customers. We define your key actions, track calls and forms, tag campaigns and connect leads to your CRM, so you can see revenue per visitor and lead-to-customer rates.
Then we break conversion down by page, source, device and language, fix the biggest leaks first and report a short monthly dashboard. Engagements begin with a tracking and conversion review through our UI/UX web design team.
Related reading
Frequently asked questions
Which website metrics matter most for revenue?
Leads or sales, conversion rate, lead-to-customer rate and revenue per visitor. For paid traffic, add cost per lead; for stores, add average order value.
Are page views and time on site useful?
As clues, not goals. They describe activity, but they can rise while sales fall. Judge the website by leads, sales and revenue.
Why break conversion down by device?
Many sites convert far worse on phones than on computers. Seeing the gap shows whether the mobile experience is losing customers.
How do we connect website visits to revenue?
Set up key events for calls, forms, bookings and purchases, track phone calls, tag campaign links and pass lead details to your CRM, so you can see which visits became paying customers.
What should a monthly website dashboard include?
Leads or sales by source, conversion rate overall and on mobile, lead-to-customer rate, revenue per visitor and page speed on key pages, each with an owner.
What should we fix first?
The step where the most people drop off, such as a slow page, a long form or a broken checkout. One large leak usually matters more than many small tweaks.
Ready to see whether your website makes money? Astra Results Marketing connects your website's visits to customers and revenue, finds where visitors drop off by page, source and device, and fixes the biggest leaks first, with a short dashboard you can act on. ▸ CALL (786) 321-2866 · ▸ REQUEST YOUR CONSULTATION