Rated 5 star on

Automation KPIs: Hours Returned, Errors Removed
Quick answer
Measure automation on hours returned, errors removed, cycle time and adoption, all against a baseline recorded before anything changes. The baseline is the project's most important artifact, because a number nobody captured beforehand cannot be claimed afterward. Tasks processed, uptime and messages sent describe the software rather than the business, and should not lead a review.
Automation projects are unusually easy to declare successful and unusually hard to prove successful. A dashboard shows thousands of tasks processed, the vendor reports uptime, and nobody can say whether the business is better off. The numbers that would answer that question are almost always the ones nobody recorded before the project started.
Key Takeaways
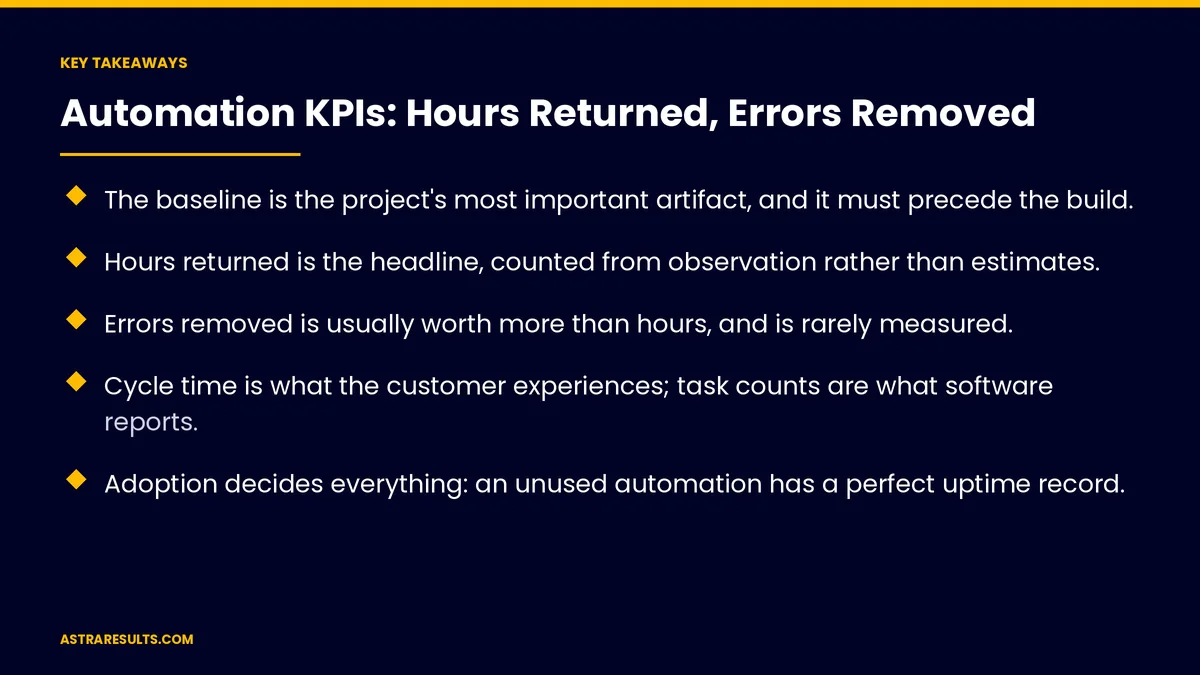
- The baseline is the project's most important artifact, and it must precede the build.
- Hours returned is the headline, counted from observation rather than estimates.
- Errors removed is usually worth more than hours, and is rarely measured.
- Cycle time is what the customer experiences; task counts are what software reports.
- Adoption decides everything: an unused automation has a perfect uptime record.
- Tasks processed, uptime and automation rate are inputs, not outcomes.
Published: September 6, 2026 | Reading Time: ~12 minutes | Category: AI Automation
This piece is about measuring automation properly. Which numbers matter, why the baseline has to exist before anything changes, how to count hours returned without fooling yourself, and which commonly reported metrics tell you nothing. Stated simply: if you did not measure it before, you cannot claim it after.
Guidance for owners and operators. Nothing here is financial or accounting advice. Labour cost calculations and any decisions affecting staffing should involve the business's accountant and, where employment is affected, qualified counsel.
In This Playbook
- The baseline, recorded before anything changes
- Hours returned, counted properly
- Errors removed, which is the bigger number
- Cycle time: what the customer feels
- Adoption, the metric that decides the rest
- The metrics that tell you nothing
- Putting it in a monthly review
- Ninety days, in order
The baseline, recorded before anything changes
- Why it comes first. After the process changes, nobody can reconstruct what it cost before. Memory is generous about improvement.
- What to record. How long the process takes end to end, how much of that is waiting rather than working, how many people touch it, how often it produces an error, and what an error costs to fix.
- How to get it. Observation for a week or two, not a survey. Ask someone how long a task takes and the answer is the time it takes when it goes well, which is not the average.
- The exception rate. What share of cases go off the standard path, because that number determines how much of the process automation can handle, as detailed in describing a process before automating it.
- The direct version. Baseline measurement reveals the process is worse than anyone claimed, which is uncomfortable and is the point.
- Who records it. Someone who will not be judged by the number.
Hours returned, counted properly
- The definition. Person-hours no longer spent on the process, measured after the automation has settled rather than in the first enthusiastic week.
- The calculation. Baseline hours per period minus current hours per period, including the new work the automation created — exception handling, reviewing flagged items, and maintaining the system.
- The mistake that inflates it. Counting the hours the old process consumed and ignoring the hours the new one requires. A process that took twenty hours and now takes four plus three of exception handling returned thirteen, not sixteen.
- What the hours become. This is a business decision, not a measurement one. Capacity for growth, reassignment to higher-value work, or reduced overtime. Being explicit about which prevents the awkward gap between a promised saving and a payroll that did not change.
- The conversion to money. Hours times a fully loaded cost, computed with the accountant rather than with a salary figure.
Errors removed, which is the bigger number
- Why it is undervalued. Errors are episodic and invisible in aggregate, so businesses underestimate them until they are counted.
- What to count. Rework, duplicate payments, wrong orders, missed deadlines, incorrect invoices, compliance failures and the customer goodwill spent apologizing.
- The cost of one error. Time to detect, time to correct, the direct financial cost, and the relationship cost. Most businesses have never calculated this for their common failure modes.
- The comparison. Error rate before and after, on the same definition, over a comparable period.
- The subtlety. Automation removes some errors and introduces others — a misclassification, a wrong routing, an extraction mistake. The honest measure is net, and the new errors have to be counted rather than excused.
- Where it lands hardest. Processes touching money or compliance, where one prevented error can exceed a year of hours saved, as covered in what matching catches.
Cycle time: what the customer feels
- The definition. Elapsed time from trigger to completion, including waiting.
- Why it matters more than effort. A quote that takes twenty minutes of work and four days to reach the customer is a four-day quote as far as the customer is concerned.
- The split to track. Work time versus wait time. Automation usually reduces wait time far more than work time, and reporting only total hours hides the improvement the customer actually noticed.
- Where it converts to revenue. Faster quotes close more often, faster invoices get paid sooner, faster responses win more leads, as explored in where work stalls.
- How it is measured. Median rather than average, because a handful of stuck cases distort the mean and hide the typical experience.
Adoption, the metric that decides the rest
- The failure mode. A perfectly functioning automation that people work around, so the old process continues in parallel and the business pays for both.
- What to measure. The share of eligible cases going through the automated path, and the share of people using it as designed.
- Why people work around it. Usually because it does not handle their real cases, because nobody trained them, or because they were not consulted and it shows.
- The early warning. Adoption that starts high and declines means the system handles the easy cases and fails the real ones.
- The fix. Ask the people working around it what it does not handle. The answer is almost always specific and fixable.
- The principle. An automation with excellent technical metrics and low adoption has failed, regardless of what the dashboard says.
The metrics that tell you nothing
- Tasks processed. Volume of activity, not value. A system processing ten thousand tasks may be doing work that did not need doing.
- Uptime. Necessary and not informative. Nobody bought automation for uptime.
- Automation rate. The share of a process handled without a human, which sounds meaningful and is not — pushing it higher by automating cases that should be reviewed makes things worse.
- Time saved per task, multiplied out. A calculation that turns a two-minute estimate into an annual figure with three digits of false precision.
- Cost per transaction, in isolation. Useful only against the baseline cost of the same transaction before.
- A quick test. Would this number change if the automation were doing the wrong thing perfectly? If yes, it is not measuring outcomes, as set out in inputs versus outputs.
Putting it in a monthly review
- Five lines. Hours returned this month against baseline. Error rate against baseline. Median cycle time against baseline. Adoption rate. Exceptions handled and what caused them.
- The exception analysis. The most useful recurring item, because the pattern in exceptions tells you what to build next and what the process looks like.
- The comparison discipline. Always against the recorded baseline, never against last month, so drift over a year stays visible.
- Length. Fifteen minutes. If it takes longer, the metrics are not decision-ready.
- The decision it should produce. Expand, adjust, or stop — with stop being a legitimate outcome that should be exercised occasionally.
Ninety days, in order
Days 1–30: baseline only
The process observed rather than surveyed. End-to-end time, wait time, people involved, error rate, error cost and exception rate recorded by someone not being judged by the result.
Days 31–60: run in parallel
The automation live alongside the existing process. New errors it introduces counted alongside the ones it removes. Adoption tracked from the first week.
Days 61–90: first honest read
Hours returned net of new work, error rate net of new errors, median cycle time and adoption, all against the recorded baseline. The decision made on those five numbers.
How does Astra measure an automation programme?
Astra Results Marketing records the baseline before building anything, by observation rather than by asking, and by someone who will not be judged by the number — because a project without a baseline can only be evaluated on the vendor's dashboard.
Hours returned are counted net of the exception handling and maintenance the automation creates, errors are counted net of the new ones it introduces, and adoption is tracked from week one because an unused automation has a perfect uptime record. Where the honest read says stop, that is the recommendation. Engagements begin with a baseline measurement through our business consulting team.
Related reading
Frequently asked questions
Why does the baseline have to come first?
Because after the process changes nobody can reconstruct what it cost before, and memory is generous about improvement. Record end-to-end time, how much of it is waiting rather than working, how many people touch it, the error rate and what an error costs — by observation over a week or two rather than by survey, since asking how long a task takes yields the time it takes when it goes well.
How are hours returned counted properly?
Baseline hours per period minus current hours per period, including the new work the automation created: exception handling, reviewing flagged items and maintaining the system. A process that took twenty hours and now takes four plus three of exception handling returned thirteen, not sixteen. Converting to money uses a fully loaded cost computed with the accountant, not a salary figure.
Why are errors removed worth more than hours?
Because errors are episodic and invisible in aggregate, so businesses underestimate them until counted — rework, duplicate payments, wrong orders, missed deadlines, incorrect invoices, compliance failures and the goodwill spent apologizing. In processes touching money or compliance, one prevented error can exceed a year of hours saved. The measure must be net, since automation also introduces its own errors.
What is the difference between cycle time and effort?
Cycle time is elapsed time from trigger to completion including waiting, which is what the customer experiences — a quote taking twenty minutes of work and four days to arrive is a four-day quote. Automation cuts wait time far more than work time, so reporting only hours hides the improvement customers noticed. Track the median, since stuck cases distort the average.
Why is adoption the metric that decides the rest?
Because a perfectly functioning automation that people work around means the old process continues in parallel and the business pays for both. Measure the share of eligible cases going through the automated path. Adoption that starts high and declines means the system handles easy cases and fails real ones — and asking the people working around it what it does not handle usually produces a specific, fixable answer.
Which automation metrics are misleading?
Tasks processed, which is activity rather than value. Uptime, which is necessary and uninformative. Automation rate, which gets worse when pushed higher by automating cases that should be reviewed. Time saved per task multiplied into an annual figure with false precision. The test: would this number change if the automation were doing the wrong thing perfectly?
READY TO MEASURE AUTOMATION PROPERLY? Astra Results Marketing records the baseline by observation before building, counts hours and errors net of what the automation creates, tracks adoption from week one, and recommends stopping when the read says so. Astra Results Marketing · 1101 Brickell Ave, Miami, FL 33131 · +1 (786) 321-2866 · [email protected] Find us on Google · Yelp ▸ CALL (786) 321-2866 · ▸ REQUEST YOUR CONSULTATION