Rated 5 star on


SaaS Data: Product, Billing, Support in One Place
Quick answer
SaaS companies should join product, billing and support data by account so churn and expansion signals become visible. Link every system with one account ID. Agree on definitions for revenue, churn and active users. Build account health from usage, tickets and billing status. Respect customer data terms and give each team its own dashboard.
Software companies collect data everywhere: product usage in one system, subscriptions in billing, tickets in support and deals in the CRM. Each team sees its own slice. Nobody sees that a big customer stopped using a key feature before renewal. Bringing the data together by account turns those scattered signals into early warnings and clear opportunities.
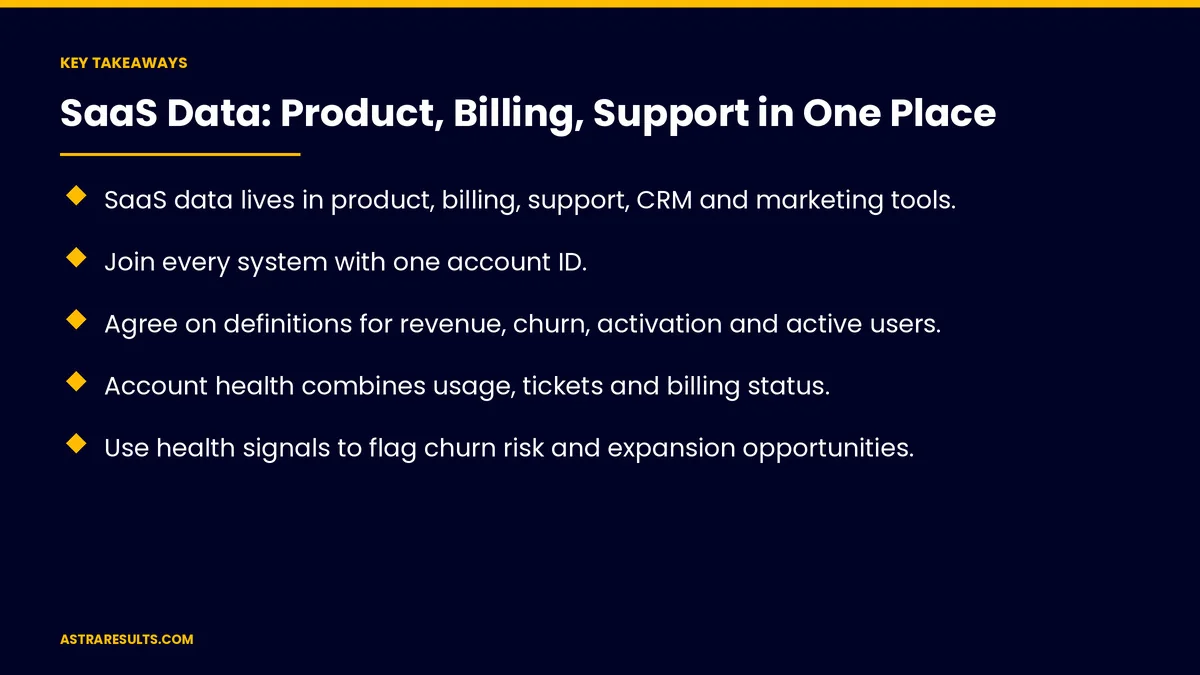
Key Takeaways
- SaaS data lives in product, billing, support, CRM and marketing tools.
- Join every system with one account ID.
- Agree on definitions for revenue, churn, activation and active users.
- Account health combines usage, tickets and billing status.
- Use health signals to flag churn risk and expansion opportunities.
- Respect customer data terms and give each team its own dashboard.
Published: October 25, 2026 | Reading Time: ~9 minutes | Category: Data Engineering
This guide covers combining SaaS data: where it lives, one account ID, shared definitions, account health, churn alerts, expansion signals, product decisions, support priority, privacy, data quality, dashboards by team and what to measure. Put plainly: join every system by account, agree on definitions and act on health signals before renewals.
In This Playbook
- Where SaaS data lives
- Why does every SaaS system need one account ID?
- Shared definitions
- Account health
- Churn alerts
- Which signals point to an account ready to expand?
- Product decisions
- Support priority
- Privacy
- Data pipelines
- Dashboards by team
- What to measure
- The first three months
Where SaaS data lives
Product usage. Logins, features used and activity.
Billing. Plans, invoices, upgrades and cancellations.
Support. Tickets, topics and satisfaction.
CRM. Accounts, contacts and renewals.
Marketing. Sign-ups and campaigns.
Why does every SaaS system need one account ID?
The same ID everywhere. So data joins cleanly.
Map old records. Match accounts across systems once.
Clean data first. As covered in data KPIs.
Shared definitions
Recurring revenue. What counts, and when.
Churn. Lost accounts and lost revenue, measured separately.
Activation. The action that shows a new customer got value.
Active user. One definition for every team.
Account health
Usage trends. Rising, steady or falling.
Key features. Used or abandoned.
Support load. Tickets per account and open issues.
Billing status. Late payments or downgrades.
Churn alerts
Falling usage before renewal. Flagged early.
Rising tickets. Especially unresolved ones.
Champion left. The main contact stopped logging in.
Simple rules first. As covered in predictive analytics for small businesses.
Which signals point to an account ready to expand?
Hitting plan limits. Users, storage or features.
New teams joining. Usage spreading across a company.
Handed to sales. With context attached.
Product decisions
Features that drive retention. Used by accounts that stay.
Features nobody uses. Candidates to fix or remove.
Mobile use. As in SaaS companion apps.
Support priority
Valuable accounts first. Without ignoring smaller ones.
Context for agents. Plan, usage and history, as in support ticket routing.
Better help content. As in SaaS GenAI.
Privacy
Follow your customer agreements. What data you may use, and how.
Minimal personal data. Account-level views where possible.
Access by role. Teams see what they need.
Data pipelines
Moved automatically. From each system into one place, as covered in data pipelines explained.
Right-sized. As weighed in is data engineering right for your size.
Dashboards by team
Customer success. Health and renewals.
Sales. Expansion signals.
Product. Feature use and retention.
Leadership. Revenue, churn and growth, with reports before predictions, as weighed in ML vs business intelligence.
What to measure
Churn rate. Accounts and revenue.
Expansion revenue. From flagged accounts.
Alerts acted on. Before renewal.
Activation rate. New accounts reaching first value.
Report trust. Same numbers across teams.
The first three months
Days 1–30: join and define
Map one account ID across systems and agree on definitions for revenue, churn, activation and active users.
Days 31–60: build health views
Combine usage, tickets and billing by account and build dashboards for each team.
Days 61–90: act
Turn on churn and expansion alerts, assign owners and track what happens before renewals.
How Astra connects SaaS data
Astra Results Marketing brings SaaS product, billing and support data together by account. We map one account ID, agree on definitions, build health views and dashboards for each team and set up alerts that reach the right people before renewals.
Engagements begin with a data review through our data engineering team.
Related reading
Frequently asked questions
Why combine SaaS data by account?
Because churn and expansion signals hide across product, billing and support systems. Joined by account, they become clear.
What is an account health view?
A combined view of usage trends, key feature use, support load and billing status for each customer.
What signals point to churn?
Falling usage before renewal, rising unresolved tickets and the main contact no longer logging in.
What signals point to expansion?
Hitting plan limits and new teams starting to use the product.
How should privacy be handled?
Follow your customer agreements, keep personal data minimal and limit access by role.
What should we measure?
Churn rate, expansion revenue, alerts acted on, activation and whether teams trust the same numbers.
Ready to see every customer's health in one place? Astra Results Marketing joins your product, billing and support data by account, agrees definitions and sets up alerts before renewals. ▸ CALL (786) 321-2866 · ▸ REQUEST YOUR CONSULTATION