Rated 5 star on


Data KPIs: Freshness, Completeness, Use
Quick answer
A few data KPIs show whether data can be trusted and is actually used. Freshness shows whether data updated on time, and completeness shows whether key fields are filled. Accuracy and consistency check numbers against their source. Pipeline reliability tracks breaks and fixes. Give every important dataset an owner, alerts and a short monthly scorecard.
A dashboard that's a day late, missing half its values or never opened is worse than no dashboard at all, because people stop trusting the numbers. Many businesses invest in data pipelines and reports without measuring whether the data is current, complete and used in decisions. A few simple KPIs show whether data is earning its keep.
Key Takeaways
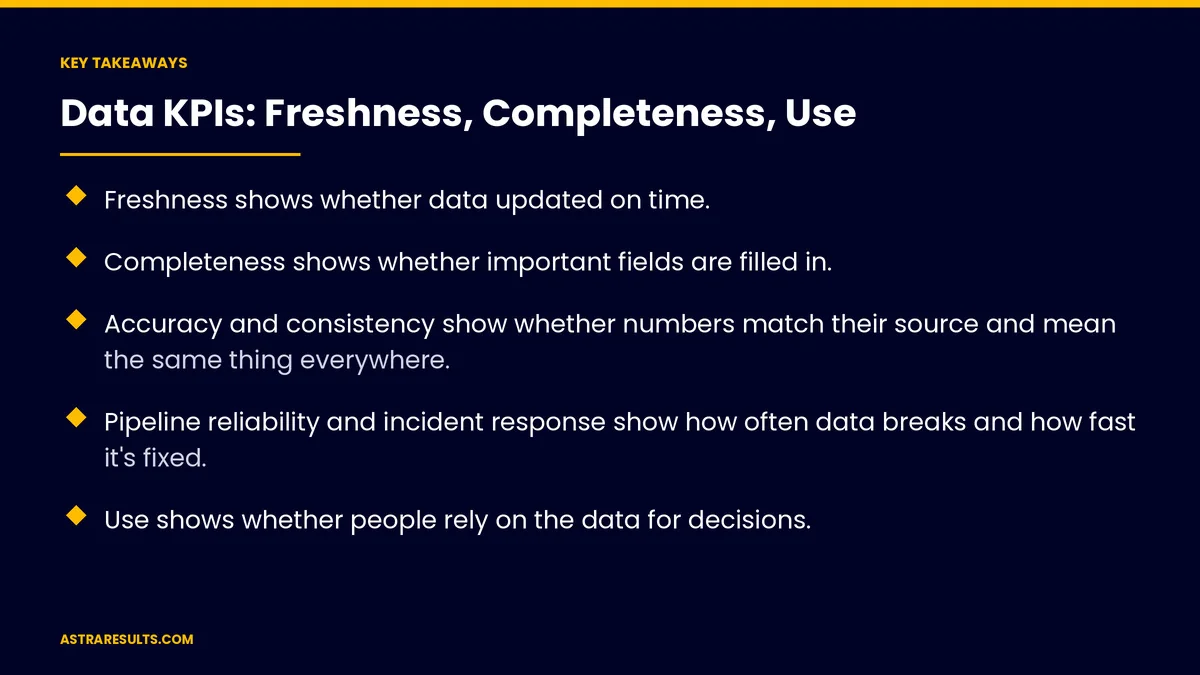
- Freshness shows whether data updated on time.
- Completeness shows whether important fields are filled in.
- Accuracy and consistency show whether numbers match their source and mean the same thing everywhere.
- Pipeline reliability and incident response show how often data breaks and how fast it's fixed.
- Use shows whether people rely on the data for decisions.
- Give every important dataset an owner, alerts and a short monthly scorecard.
Published: October 1, 2026 | Reading Time: ~8 minutes | Category: Data Engineering
This guide covers the data KPIs that matter: freshness, completeness, accuracy, consistency, duplicates and formats, pipeline reliability, incident response, use and cost, plus who owns each and how to report them. Put plainly: measure whether data is fresh, complete and trusted, and whether anyone uses it to decide.
In This Playbook
- Why data needs KPIs
- Freshness
- How do we measure data completeness?
- Accuracy
- What does data consistency mean for reports?
- Duplicates and formats
- Pipeline reliability
- Incident response
- Use
- Ownership and reporting
- What to measure
- The first three months
Why data needs KPIs
Trust is fragile. One wrong number can make people ignore every report.
Problems hide. Late or incomplete data often looks normal at a glance.
Spending needs a return. Data tools and people cost money, as covered in what data infrastructure costs.
Few clear numbers. A short list everyone understands, the same principle as in task management KPIs.
Freshness
Time since the last good update. For each important dataset.
Compared with expectations. Daily reports should update daily; live dashboards more often.
Alerts when late. Owners hear about delays before users notice.
How do we measure data completeness?
Missing values in fields that matter. Such as customer email, order amount or location.
Share of complete records. Tracked over time.
Find the source. Missing data often starts with a form, an import or a manual process.
Accuracy
Match against the source. Totals in reports should match the system they came from.
Regular checks. Compare sales, orders or donations with the original records, as in reconciling with accounting in one donor record across systems.
Investigate gaps. Small differences can point to bigger problems.
What does data consistency mean for reports?
One definition. "Active customer" or "revenue" means the same thing in every report.
Shared definitions documented. So teams don't calculate differently.
Same numbers everywhere. Different dashboards shouldn't disagree.
Duplicates and formats
Duplicate records. The same customer or product appearing more than once.
Valid formats. Phone numbers, dates and codes in the expected form.
Fix at the source. Better forms and imports prevent repeat problems.
Pipeline reliability
On-time runs. Share of scheduled data jobs that complete on time.
Failures. How often jobs fail, and which ones.
How pipelines work is covered in data pipelines explained.
Incident response
Time to detect. How long before someone knows data is wrong or late.
Time to fix. How long to restore correct data.
Tell users. A short note when data is affected, so nobody acts on bad numbers.
Use
Active users. People who open dashboards and reports.
Views of key reports. Which ones are used, and which are ignored.
Decisions supported. Decisions that rely on the data, such as pricing, staffing or stock.
Retire unused reports. Fewer, better reports are easier to trust.
Ownership and reporting
Name an owner for each important dataset. Responsible for quality and fixes.
Alerts to owners. For freshness, failures and big drops in completeness.
A monthly scorecard. A few numbers per dataset, with notes on problems and fixes.
Connect to business value. Data that supports decisions, such as predictive analytics and demand forecasting, needs quality first.
What to measure
Freshness. Datasets updated on time.
Completeness. Share of complete records in key fields.
Accuracy gaps. Differences from source systems.
Pipeline on-time rate. And failures.
Active users of key reports. Month by month.
The first three months
Days 1–30: choose datasets and owners
List the datasets and reports that matter most, name an owner for each and agree on definitions for key numbers. Record current freshness, completeness and use.
Days 31–60: add checks and alerts
Set up freshness and failure alerts, completeness checks on key fields and regular accuracy comparisons with source systems.
Days 61–90: report and improve
Publish a short monthly scorecard, fix problems at their source and retire reports nobody uses. Compare quality and use with the baseline.
How Astra measures data quality
Astra Results Marketing helps businesses measure whether their data is fresh, complete, accurate and used. We name owners, set up checks and alerts, document shared definitions and build short scorecards.
We fix problems at the source and retire reports nobody uses. Engagements begin with a data quality review through our data engineering team.
Related reading
Frequently asked questions
What are the most important data KPIs?
Freshness, completeness, accuracy, consistency, pipeline reliability, incident response and use. Start with the few that matter most for your key reports.
What is data freshness?
How recently data was successfully updated, compared with how often it should update. Late data can mislead decisions.
How do we measure data accuracy?
Compare totals and records in reports with the source systems they came from, and investigate any differences.
Why measure whether data is used?
Data that nobody uses still costs money. Tracking use shows which reports matter and which can be retired.
Who should own data quality?
A named owner for each important dataset, responsible for checks, alerts and fixes.
How often should we report data KPIs?
Alerts in real time for problems, plus a short monthly scorecard with a few numbers per dataset.
Ready to know your data can be trusted? Astra Results Marketing sets up data KPIs, owners, checks and alerts, documents shared definitions and builds scorecards that show whether your data is fresh, complete and used. ▸ CALL (786) 321-2866 · ▸ REQUEST YOUR CONSULTATION