Rated 5 star on

Task Management KPIs: Cycle Time and Stalls
Quick answer
Counting completed tasks hides slow work, so teams need a few flow measures instead. Cycle time shows how long tasks take from start to done. Throughput counts tasks finished each week. Stalled tasks with no recent update are early warnings, and reopens show broken handoffs. Use these metrics to fix the process, not punish people.
A task board full of activity can still hide slow work. Tasks sit "in progress" for weeks, approvals wait in someone's inbox and finished work comes back for fixes. Counting completed tasks won't show that. A few clear measures do, and they point to fixes in the process, not blame.
Key Takeaways
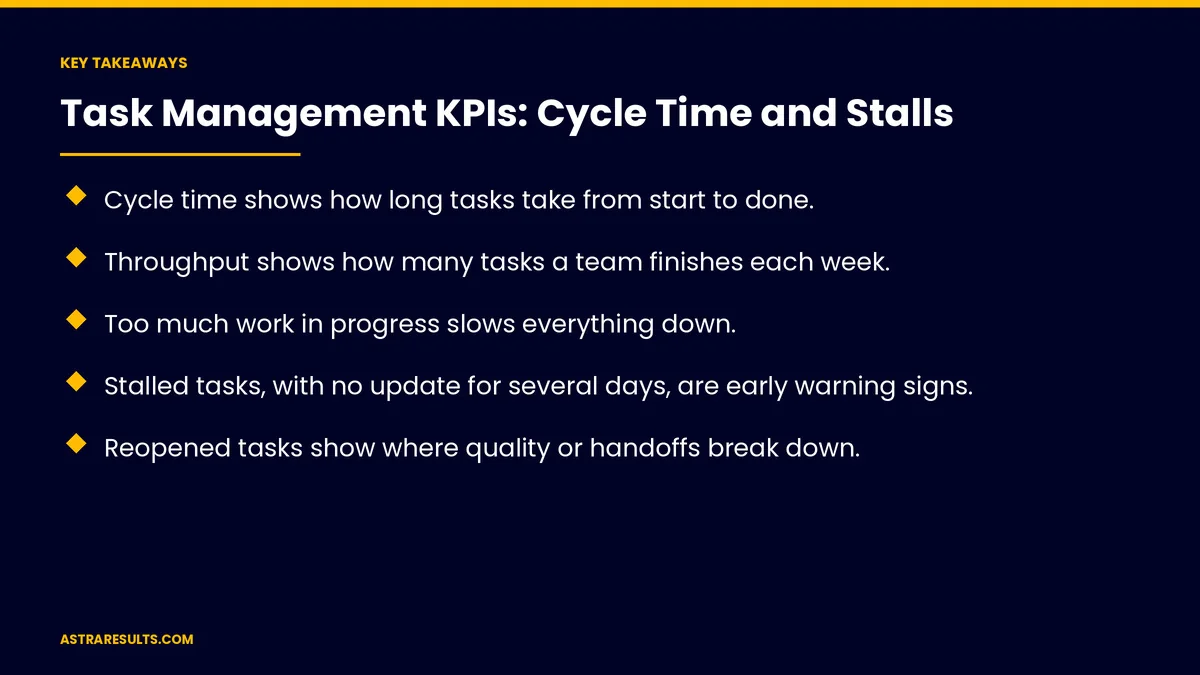
- Cycle time shows how long tasks take from start to done.
- Throughput shows how many tasks a team finishes each week.
- Too much work in progress slows everything down.
- Stalled tasks, with no update for several days, are early warning signs.
- Reopened tasks show where quality or handoffs break down.
- AI can flag stalls and late risks, but metrics should improve the system, not punish people.
Published: October 15, 2026 | Reading Time: ~8 minutes | Category: AI Task Manager
This guide covers the task management KPIs that matter: cycle time, lead time, throughput, work in progress, stalled tasks, blocked time, reopens and on-time rate, how to measure them, how AI helps spot problems early and how to use the numbers fairly. Put plainly: measure how work flows, find where it stops and fix the system.
In This Playbook
- Why counting tasks isn't enough
- Cycle time and lead time
- How is task throughput measured?
- Work in progress
- Stalled tasks and blocked time
- Reopens, on-time rate and handoffs
- How AI helps
- Using metrics fairly
- What belongs on a task management KPI dashboard?
- What to measure
- The first three months
Why counting tasks isn't enough
Busy isn't the same as flowing. Many open tasks can mean work is stuck.
Big and small tasks look alike. A count hides how long work takes.
Delays hide in waiting. Tasks often spend more time waiting than being worked on.
The basics of AI task management are covered in work that moves itself.
Cycle time and lead time
Cycle time. From when work starts to when it's done.
Lead time. From when the request arrives to when it's done.
The gap between them. Time spent waiting before anyone starts.
Track by task type. Design, approvals and client requests have different normal ranges, as do maintenance jobs, as in manufacturer task management.
How is task throughput measured?
Tasks finished per week. A simple measure of output.
Steady is good. Big swings suggest uneven workloads or batching.
Compare by type. Throughput for small tasks and large projects shouldn't be mixed.
Work in progress
How many tasks are active at once. Per person and per team.
Too much slows everything. Switching between many tasks delays all of them.
Set limits. A cap on active tasks helps finish work before starting more.
Stalled tasks and blocked time
Stalled. No update for a set number of days, such as three.
Blocked. Waiting on someone or something outside the team.
Find patterns. Which steps, approvals or people tasks wait on most.
Act early. A quick nudge or reassignment prevents missed deadlines.
Reopens, on-time rate and handoffs
Reopen rate. Tasks marked done that come back for fixes.
On-time rate. Share of tasks finished by their due date.
Handoffs. How many times a task changes hands; more handoffs often mean more delays.
Unclear tasks. High reopens often trace back to vague requests.
How AI helps
Spot stalls. Flag tasks with no updates and nudge owners.
Summarize blockers. Pull together what's holding work up, including items from meetings, as covered in meeting notes to action items.
Predict late tasks. Highlight work likely to miss its due date.
Suggest next steps. Draft reminders or reassignments for a person to approve, as covered in the action layer.
Using metrics fairly
Measure the system. Look at teams and steps, not individual scorecards.
Context matters. Some tasks are harder or depend on others.
Share openly. Teams should see their own numbers and help fix problems.
Never punish with metrics. People game numbers when they feel judged.
Protect access. Dashboards follow the same permissions as tasks, as covered in task manager security.
What belongs on a task management KPI dashboard?
Start with five measures. Cycle time, throughput, work in progress, stalled tasks and reopen rate.
Use your baseline. Set targets from current numbers, not industry guesses.
Review weekly. A short team review of trends and stalls.
Right-size it. Small teams need fewer measures, as weighed in the team of five question.
Ask your partner. A good provider helps set this up, as covered in what to ask before hiring a task management partner.
What to measure
Cycle time. Median, by task type.
Throughput. Tasks finished per week.
Work in progress. Active tasks per person and team.
Stalled tasks. Count and age.
Reopen and on-time rates. Quality and reliability.
The first three months
Days 1–30: baseline
Make sure tasks have clear start, done and due dates. Record cycle time, throughput, work in progress, stalled tasks and reopen rate for the past few months.
Days 31–60: dashboard and alerts
Build a simple team dashboard with the five measures and set stall alerts. Start a short weekly review focused on fixing blockers.
Days 61–90: improve the system
Set work-in-progress limits, clarify task requests to reduce reopens and add AI nudges for stalls. Compare the five measures with the baseline.
How Astra sets up task management KPIs
Astra Results Marketing helps teams measure how work flows. We set up dashboards for cycle time, throughput, work in progress, stalls and reopens, add AI alerts for stalled and at-risk tasks and run short reviews that fix the system.
Metrics stay at the team level, and access follows your task permissions. Engagements begin with a workflow and metrics review through our AI task manager team.
Related reading
Frequently asked questions
What is cycle time in task management?
The time from when work on a task starts to when it's done. Lead time also includes waiting from when the request arrived.
What counts as a stalled task?
A task with no update for a set number of days, such as three. Stalls are early warnings that work is stuck.
Why limit work in progress?
Too many active tasks means constant switching, which slows everything. Limits help teams finish work before starting more.
What does a high reopen rate mean?
Tasks are being marked done before they really are, often because requests were unclear or handoffs broke down.
How does AI help with task KPIs?
It flags stalled tasks, summarizes blockers, predicts tasks likely to run late and drafts reminders or reassignments for people to approve.
Should we use these metrics to rate employees?
No. Use them to find and fix problems in the process. People game numbers when they feel judged.
Ready to see where work really slows down? Astra Results Marketing sets up task management dashboards for cycle time, throughput, stalls and reopens, with AI alerts and weekly reviews that fix the system. ▸ CALL (786) 321-2866 · ▸ REQUEST YOUR CONSULTATION