Rated 5 star on

What Data Infrastructure Costs at Each Stage
Quick answer
Data infrastructure costs grow in stages, with each stage adding tools, upkeep and people. Costs fall into storage and computing, connectors, tools, people and monitoring. People are usually the largest cost. Data freshness, report refresh rates and retained volume drive most cloud bills. Cut duplicate tools and review spending every quarter.
Data infrastructure costs creep up quietly. A connector here, a dashboard license there, a warehouse bill that doubles after someone sets reports to refresh every five minutes. Most businesses never see the full number until it surprises them. Knowing what each stage needs, and what drives each cost, keeps spending matched to the value the data brings.
Key Takeaways
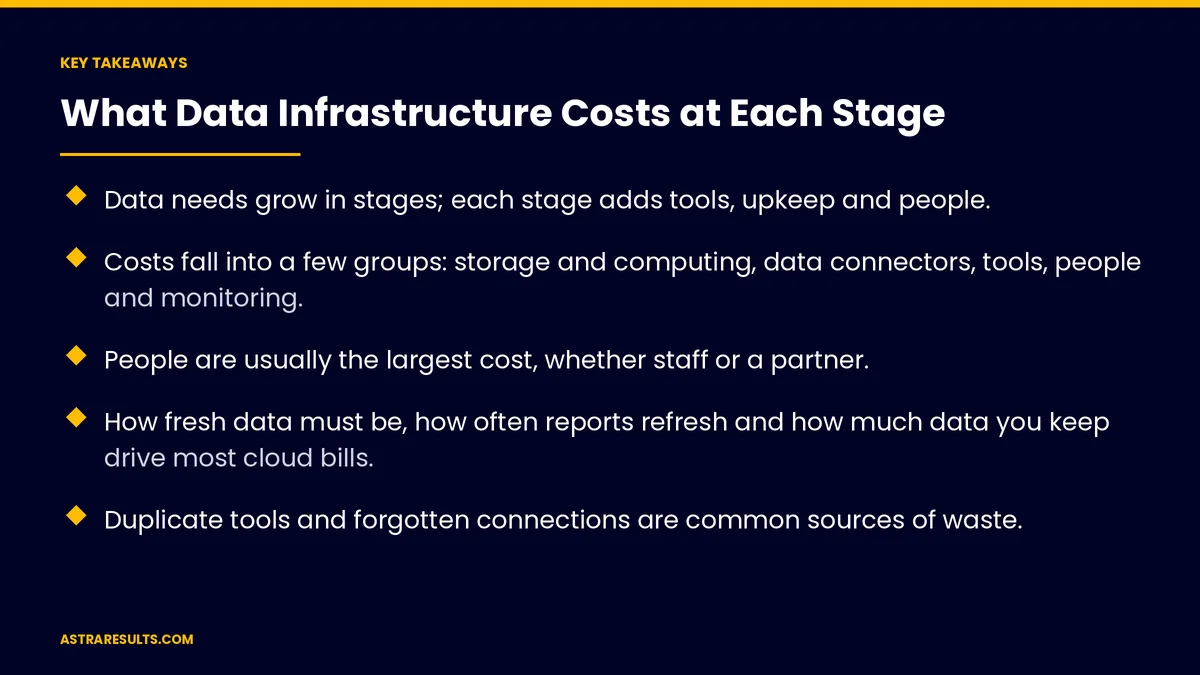
- Data needs grow in stages; each stage adds tools, upkeep and people.
- Costs fall into a few groups: storage and computing, data connectors, tools, people and monitoring.
- People are usually the largest cost, whether staff or a partner.
- How fresh data must be, how often reports refresh and how much data you keep drive most cloud bills.
- Duplicate tools and forgotten connections are common sources of waste.
- Match spending to the decisions the data improves, and review costs every quarter.
Published: October 30, 2026 | Reading Time: ~9 minutes | Category: Data Engineering
This guide walks through the stages most growing businesses pass through, from spreadsheets to a full data platform, the cost categories at each one, what drives the bill up and how to keep it under control. Put plainly: spend on data in step with the decisions it improves, and watch the few settings that quietly multiply the bill.
In This Playbook
- Stage 1: spreadsheets and exports
- Stage 2: a first central store
- Stage 3: clean, shared definitions
- Stage 4: fresher data and models
- Stage 5: a data platform with an owner
- The cost categories
- What drives the bill up
- Keeping costs under control
- Matching spend to value
- What data infrastructure numbers should we track?
- The first three months
Stage 1: spreadsheets and exports
What it looks like. Data lives in each tool: CRM, accounting, point-of-sale, ads. Someone exports and combines it in spreadsheets.
What it costs. Mostly staff time, which is easy to overlook.
When to move on. When reports take days to build, numbers don't match between teams or errors creep in.
Stage 2: a first central store
What it looks like. Connectors copy data from your main tools into one central store on a schedule, and a dashboard tool shows the results.
What it costs. Connector subscriptions, often priced by how much data they move; storage and computing in the central store; dashboard licenses, often priced per user; and setup time.
What it gives you. One version of the numbers, refreshed automatically. The basics are covered in data pipelines explained.
Stage 3: clean, shared definitions
What it looks like. Data is cleaned and organized into shared definitions: one meaning of "customer," "order" or "active user" for every team.
What it costs. Transformation tools, more computing and steady upkeep as sources change.
What it gives you. Numbers people trust, and a base for analysis and AI, as covered in the foundation every AI project needs.
Stage 4: fresher data and models
What it looks like. Some data updates in near real time, quality checks run automatically and models use the data for forecasts or scoring.
What it costs. Streaming tools, monitoring, more computing and specialist skills.
What it gives you. Faster decisions and models such as franchise location models. The model layers are covered in the ML stack explained.
Stage 5: a data platform with an owner
What it looks like. A small team or partner runs the platform, with access rules, documentation and a backlog of requests.
What it costs. People above all, plus governance, security and the tools of earlier stages.
What it gives you. Data as a dependable part of how the business runs.
The cost categories
Storage and computing. Cloud warehouses usually charge for storage and for the computing used to run queries. Computing is often the bigger part.
Data connectors. Tools that copy data from your apps, often priced by volume moved or number of sources.
Transformation and quality tools. Software that cleans data and checks it automatically.
Dashboards and reporting. Often priced per user or per viewer.
People. Data engineers, analysts or a partner. Usually the largest cost at every stage after the first.
Security and compliance. Access controls, audits and handling of sensitive data.
What drives the bill up
Freshness. Real-time data costs more than daily updates. Many reports don't need minute-by-minute data.
Refresh habits. Dashboards set to refresh constantly can multiply computing costs.
Data volume. Keeping everything forever adds up. Archive what's rarely used.
Number of sources. Each new connection adds connector fees and upkeep, especially when the source changes.
Inefficient queries. Badly written or repeated queries run up computing.
Duplicate tools. Two dashboard tools or two connector services doing the same job.
Keeping costs under control
Match freshness to need. Daily for most reports, faster only where decisions need it.
Set spending alerts. Most cloud services can warn you before a bill jumps.
Review refresh schedules. Slow down dashboards nobody checks hourly.
Archive old data. Move rarely used history to cheaper storage.
Remove what's unused. Old connectors, dashboards and tables.
Plan each new source. Decide who owns the data and how it connects before adding it, as covered in planning an integration.
Own your accounts. Keep cloud and tool accounts in your business's name, as with any custom software.
Matching spend to value
Start with decisions. List the decisions better data would improve, such as pricing, staffing, marketing spend or inventory.
Fund the stage those decisions need. A business deciding monthly doesn't need real-time data. A restaurant group planning prep by item and daypart needs daily data, as in restaurant group AI.
Show the return. Hours saved, errors avoided and better decisions, measured against cost.
One example. A manufacturer joining machine and quality data may need near-real-time updates on the floor but only daily cost reports, as in unifying manufacturer data.
What data infrastructure numbers should we track?
Total data cost per month. All tools, cloud and people together.
Cost by category. Storage, computing, connectors, tools and people.
Unused assets. Dashboards, tables and connectors nobody touches.
Report time saved. Hours no longer spent assembling data by hand.
Decisions supported. The decisions that now rely on the data, and their results.
The first three months
Days 1–30: know your stage and costs
List every data tool, connector, cloud account and dashboard, with what each costs. Identify your stage and the decisions data should improve.
Days 31–60: trim and right-size
Set spending alerts, slow refresh schedules that don't need speed, archive old data and remove unused tools. Match freshness to each report's real need.
Days 61–90: plan the next stage
Decide whether the next stage is worth it based on the decisions it would improve. Budget for tools, cloud and people, and set a quarterly cost review.
How does Astra plan data infrastructure?
Astra Results Marketing plans data infrastructure in step with the decisions it supports. We map what you have and what it costs, trim waste, match data freshness to real needs and plan the next stage only when it pays off.
Accounts stay in your business's name, and costs are reviewed every quarter. Engagements begin with a data and cost review through our data engineering team.
Related reading
Frequently asked questions
What does data infrastructure cost?
It depends on your stage and needs. Costs fall into storage and computing, data connectors, transformation and dashboard tools, people and security. People are usually the largest share once you move beyond spreadsheets.
Why did our cloud data bill jump?
Common causes are dashboards refreshing too often, real-time updates where daily would do, inefficient or repeated queries, growing data volume and new sources added without a plan.
Do we need real-time data?
Usually not for most reports. Daily updates suit most decisions. Pay for real-time data only where decisions need it, such as operations floors or fraud checks.
How do we keep data costs under control?
Set spending alerts, match freshness to need, slow unnecessary refreshes, archive old data, remove unused tools and review costs every quarter.
When should we move to the next stage?
When the current setup slows decisions, numbers don't match between teams or the decisions you want to improve need fresher or cleaner data. Fund the next stage based on the value of those decisions.
Should we hire a data team or use a partner?
It depends on your stage. Smaller businesses often start with a partner, then hire as data becomes central to daily operations. Either way, keep accounts and documentation in your name.
Ready to spend on data in step with its value? Astra Results Marketing maps your data tools and costs, trims waste, matches data freshness to real needs and plans each new stage around the decisions it improves, with accounts kept in your name. ▸ CALL (786) 321-2866 · ▸ REQUEST YOUR CONSULTATION